
Saint Silvester Road Race – Corrida Internacional de São Silvestre
Our app is a unique platform that aims to showcase the Saint Silvester Race’s history, culture, and stories to a wider audience
Project Summary
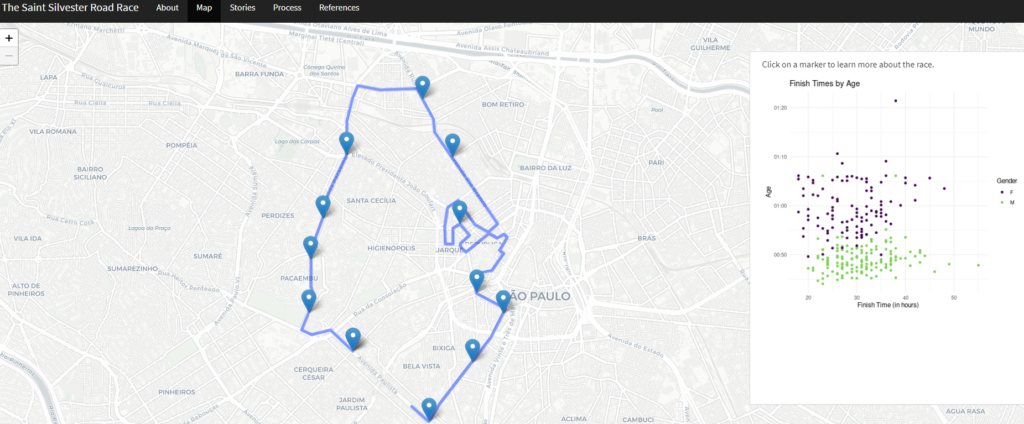
- Our app’s interactive map feature allows users to explore the route of the race and discover interesting facts and statistics through data visualizations of statistics about the event.
- It also includes a “Stories” section where users can read about the experiences of those who have participated in or watched the race, providing a platform for voices that are often overlooked due to language barriers.
- The interactive map and the “Stories” section are the fun and interactive aspects of the app. Users can explore the route of the race and discover interesting facts and statistics, as well as read about the experiences of others who have participated in or watched the race.
- Our primary goal is to share the lesser-known aspects of the Saint Silvester Race with English-speaking audiences. Our app will serve as a valuable resource for anyone interested in this iconic Brazilian event.
End Product
- This project is an R Shiny app that focuses on the Saint Silvester Race in Brazil. Its goal is to transmit the story of the race to a wider audience, particularly those who are English speakers and may not have access to resources in their own language. The app is designed to showcase the history, culture, and stories of the race and its participants.
- This app’s primary audience is anyone interested in the Saint Silvester Race and Brazilian culture.
- The app creates an interactive map of the Saint Silvester Race, highlighting key landmarks along the route and providing interesting facts and graphs about the race. It also includes a “Stories” section where users can read about the experiences of those who have participated in or watched the race.
Process and Next Steps
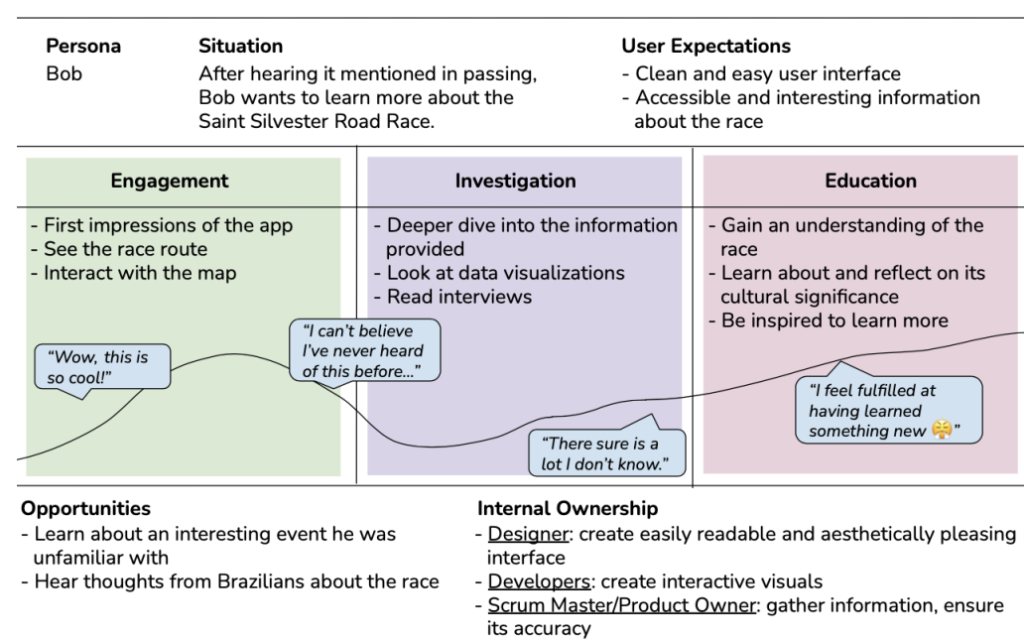
- We began with UX/UI Development Techniques, brainstorming, and then building wireframes and screen mock-ups. It also involved coding in R Shiny environment using GitHub for version control. We also followed Agile Development with Scrum Framework. In the end, we got user feedback and incorporated the feedback for a better experience for our users.
- The challenges we faced while building our app were using Leaflet and incorporating the map of the race as a reactive. Moreover, finding data for visualization was also a tough task, but eventually, we worked our way around them and are really proud of how our Stories and Map tab came about.
- Our steps forward include making the markers on the map change color depending on whether the fact corresponding to that marker is the one displayed. Additionally, we would like to continue gathering personal stories and create more interesting and interactive data visualizations.
Acknowledgments
- We want to take this opportunity to thank all the people who helped us make this app the best version of itself. We would like to thank our Professor, Prof. Fernanda Eliott, for all her feedback and input.
- Also, our course mentor, Deepit, really helped us brainstorm and pushed us to think outside of the box.
- We would also like to thank all the people who shared their stories about the race, tested the app, and gave us feedback. This app would not have been possible without the help of all these people.
References
The following resources were used for general information about the race:
- Our data were obtained from the official website of the Saint Silvester Road Race:
https://www.gazetaesportiva.com/sao-silvestre/resultados. - Wikipedia – Saint Silvester Road Race – General information about the race
- Encyclopedia Britannica – Saint Silvester – Information about Saint Silvester
- Religion Information – Information about religion composition/demographics in Brazil.
- Article About Weather – How the weather affects the race.
- News article about race – Relates the story about the early celebration
- Route of the race.
We used the following packages:
shiny, shinythemes, stringr, stringi, readr, dplyr, viridis, Ggally, hms, ggplot2, shinyglide, leaflet, base, plotly, Reactlog.
The following resources were used in the software design and
development:
System Design – Provides criteria for design evaluation.
- Daniel Jackson, The Essence of Software – Information about concepts.
- PDF text mining – Tutorial about reading tables from PDFs
- Tabulizer – tabulizer documentation
- Using the stringr and readr packages
- readr documentation
- stringr documentation
- Image settings – Using image settings to make an image span a screen
- Plotting with times – How to work with times and ggplot
- Scatterplot tutorial
- Parallel plot tutorial
- Leaflet line tutorial – How to add lines to the map to make course
- Tabulizer thread – Information about how to install Tabulizer
- Example of an app with a map
- Shiny Columns – Tutorial about how to use columns in Shiny
- Map lines