

Climate Change Visualization: Emissions and More
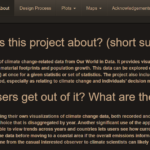
Project Summary.
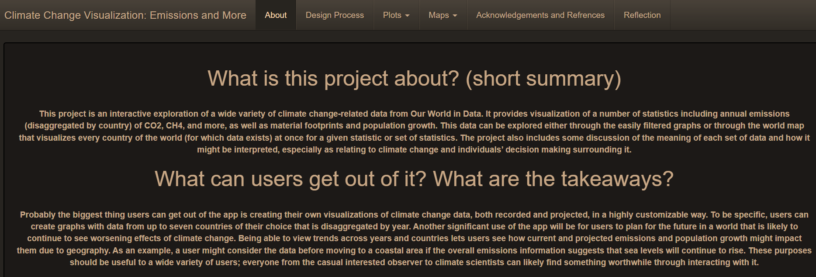
This project is an interactive exploration of a wide variety of climate change-related data from Our World in Data. It provides visualization of a number of statistics including annual emissions (disaggregated by country) of CO2, CH4, and more, as well as material footprints and population growth. This data can be explored either through the easily filtered graphs or through the world map that visualizes every country of the world (for which data exists) at once for a given statistic or set of statistics. The project also includes some discussion of the meaning of each set of data and how it might be interpreted, especially as relating to climate change and individuals’ decision-making surrounding it.
End Product
This project is about visualizing climate change data. The vision is to create an extremely interactive and user-friendly app for exploring this information. Ideally, users will be able to consider how climate change might impact their own lives in the future by playing around with the app.
Our audience includes anyone who’s interested in climate change data. This could range from scientists looking for data visualizations to just concerned citizens who want to learn more. The app is designed to be approachable to all audiences.
Our app allows users to visualize a variety of climate change data. From it, users can learn about a number of different greenhouse gasses and their emissions levels, as well as a few other statistics related to climate change.
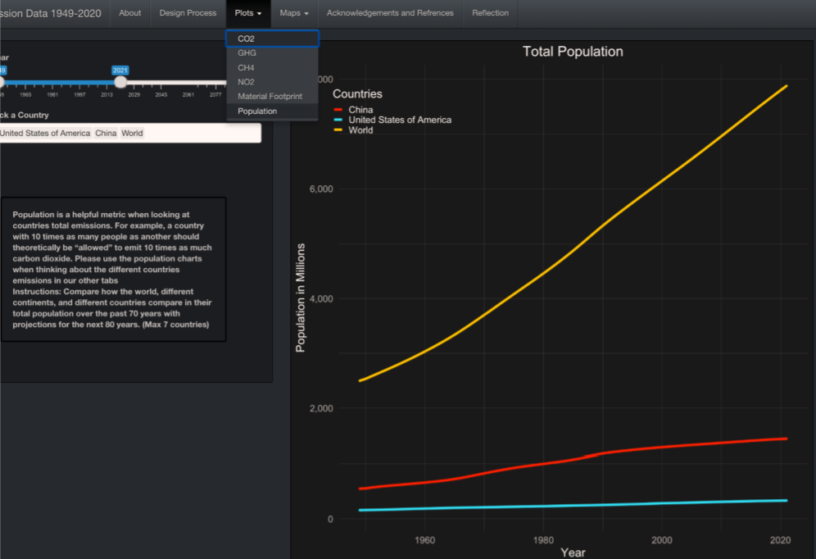
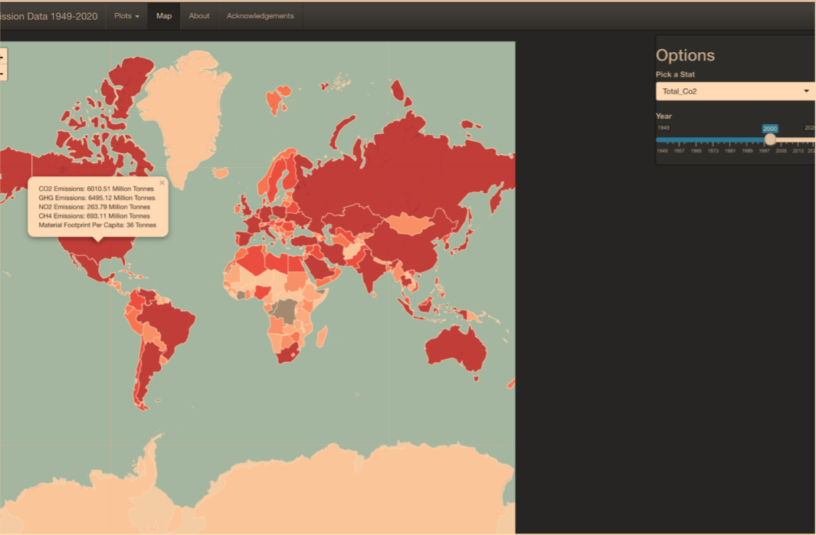
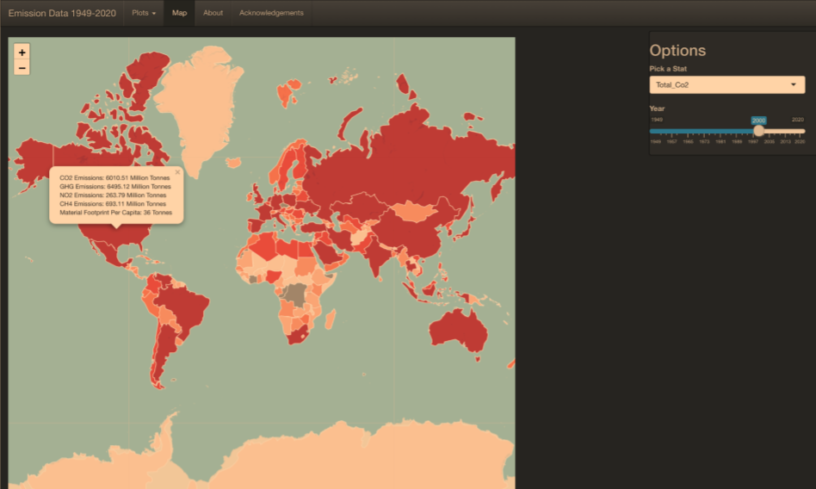
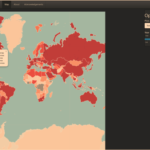
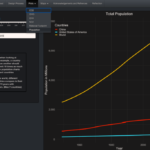
What are the fun and/or interactive aspects of your app? We have a line chart that users can customize based on country, range of years, and statistic type (i.e. CO2, total GHG, etc). We also have a map that can be customized by the range of years to visualize a chosen stat for each country, as well as allows clicking on particular countries to view all the information we have gathered on it.
Acknowledgments.
We’d like to extend a sincere thank-you to everyone who helped us at any step of this project. This particularly includes, but is not necessarily limited to:
- Professor Fernanda Eliott (course instructor).
- Davin Lin (course mentor).
- Alex Leach (alumni mentor).
- Fall 2021 CSC 324 section 2 (classmates).